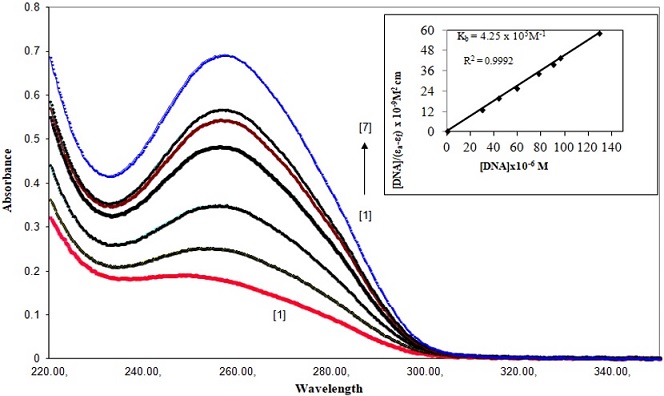
| Figure 3: Absorption spectra of complex [Pd(en)(H2O)2]2+ (2) in Tris-HCl buffer upon addition of CT-DNA. [complex] = 20 μM, [DNA] = (0) [1], (29.2) [2], (43.6) [3], (59.3) [4], (59.3) [5], (77.8) [6], 160 [7] μM. Arrow shows the absorbance changing upon the increase of DNA concentration. Inst: plot of [DNA]/(εa − εf) versus [DNA] for the titration of CT-DNA with the complex. |