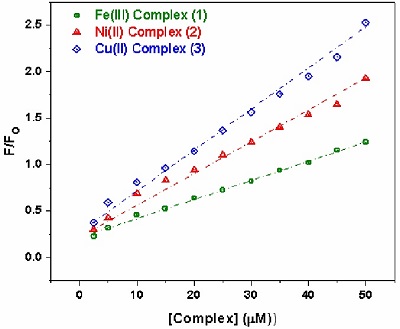
Figure 9:
Plot of F/F
0
versus [complexes (
1
)–(
3
)].