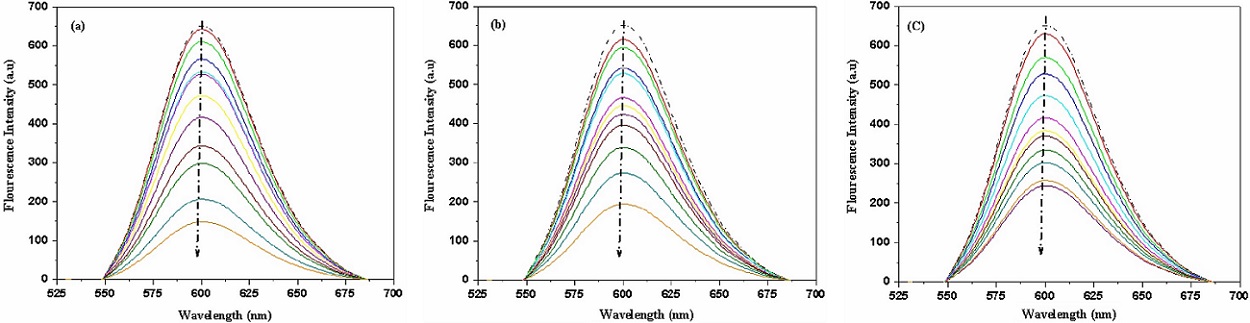
| Figure 7: Emission spectra of EtBr-CT-DNA adduct in the absence (dashed line) and presence of (a) Fe(III) complex (1), (b) Ni(II) complex (2) and(c) Cu(II) complex (3). The arrow displays the decrease in the intensity of EtBr-DNA upon increasing the concentration of the complex. |