Figure 4:
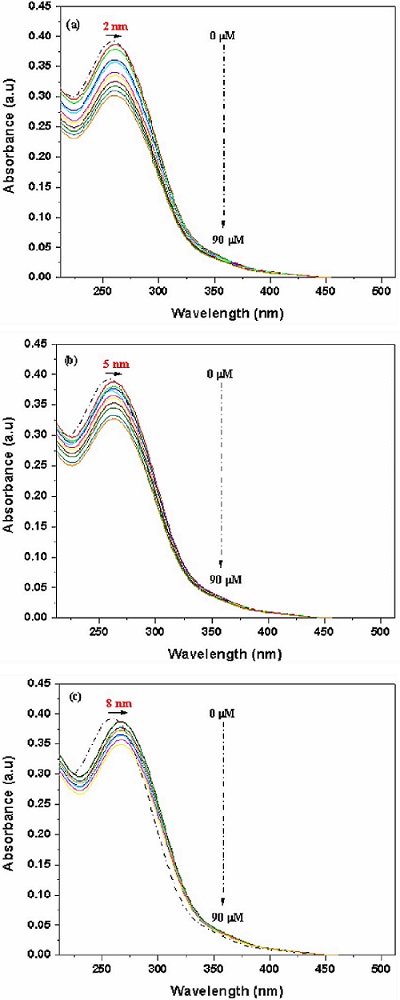
The absorption spectra of CT DNA (5
μ
M) in the absence (dashed line) and presence of 0.0–90.0
μ
M (solid line) of (a) Fe(III) complex (
1
), (b) Ni(II) complex (
2
) and (c) Cu(II) complex (
3
).