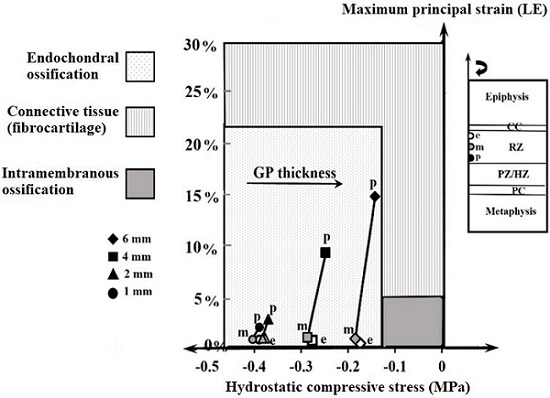
| Figure 11: Cell-averaged hydrostatic stress and maximum principal (tensile) strain in reserve zone chondrocytes when the model is subjected to 15% nominal compression. The tissue differentiation phase diagram is similar to one proposed for fracture healing at the tissue macroscale level [22] and for the proliferative and hypertrophic chondrocytes of the growth plate at the cell level [23]. |