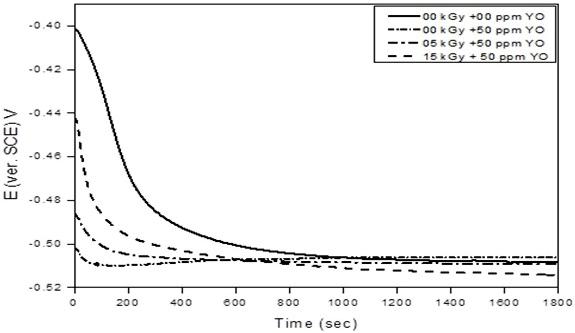
Figure 3:
Potential-time curves for CS in 0.5 M HCl in the absence and presence of 50 ppm concentrations of the AO inhibitor before and after being radiated.