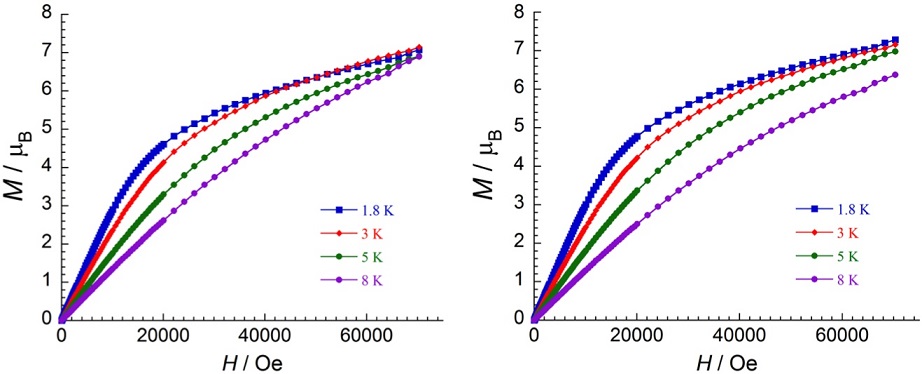
Figure 5:
Plots of magnetization (M) versus applied magnetic field (H) for complex 1 (left) and complex 2 (right) at the indicated temperatures.