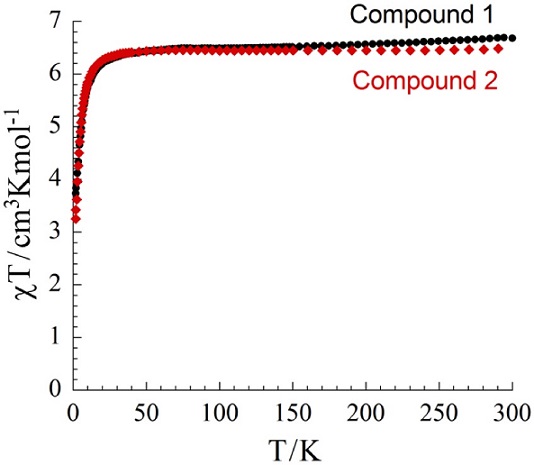
Figure 4:
Plots of χT versus T at the applied field of 0.1 T for compounds 1 and 2.